Code Health Devlog 2 - Navigation and Testing
Published on
Previous Devlog Clarifications
The tech stack consists of React, TypeScript and Esbuild. React and TypeScript is what I'm most familiar with, and the extension is for the TypeScript ecosystem so it made sense to be able to hit the ground running. VSCode extensions rely on Esbuild or Webpack for bundling; I chose the former because it is lightweight and fast.
The initial design of the interface consists of three main sections: summary, code smells breakdown, and the internal code's size. The header also includes a refresh button to use after resolving smells.
| Section | Description |
|---|---|
| Summary | A health bar calculated by percentage of internal code that includes smells. Includes supporting copy. |
| Code Smells | A breakdown of the four initial code smells. Includes a summary, with details in a disclosure widget. |
| Internal Bundle Size | Displays the uncompressed and compressed size of the internal bundle. |
The logic for the code smells is a mix of TypeScript compiler flags (partial dead code), oxlint (long parameter list), fallow (partial dead code and duplicate code), and custom pattern matchers (barrel files). The bundle size also relies on the TypeScript compiler to calculate a project's uncompressed and compressed bundle (excluding declaration files and external library code). The error state of the bundle section surprisingly showed me file errors, which I thought was neat.
Navigating To Source Files
My initial design (below the fold of the disclosure widget) only showed a list of the relative file paths and the message, but it would be a better experience for me if I could click the file in the list to go straight to the unwell code.
VSCode has several view types; however, I'm using a Webview to get the custom activity bar interface, and this runs in a sandboxed iFrame.
This means communication requires using vscode.postMessage to communicate with the host. See pseudocode below.
Autofix Dead Code
I had initially started solutionising some autofix behaviour (custom or oxlint); however, I realised I'm overcomplicating it (and deviating from the main visibility goal). If I plan to identify smells in the diff, and provide the output to my agentic workflow, I can use my judgement to get the LLM to execute fixes. Therefore, I'm going to park this idea and revisit it later if it makes sense.
Open-source Testing
I decided to choose three packages to test against, but I ran into a snag in the process. The initial solution only worked for single config repositories, which resulted in some refactoring to account for single, composite and mono style repositories.
| Package | Summary | Smells | Bundle |
|---|---|---|---|
| Zod (Single) | 10% smells unwell. | Dead Code - 33 Duplicate Code - 143 Long Parameter List - 68 Barrel Files - 8 | 1.26 MB |
| Octodeck (Composite) | 2% smells unwell. | Dead Code - 22 Duplicate Code - 13 Long Parameter List - 7 Barrel Files - 0 | 291.69 KB |
| Vite (Mono) | 7% smells unwell. | Dead Code - 551 Duplicate Code - 97 Long Parameter List - 270 Barrel Files - 16 | 1.74 MB |
Things I noticed from the analysis were that most of these packages appear to use a four parameter limit; however, I've got it set to three. Based on a quick internet search, 3-5 seems to be the standard. Knowing this, I'm going to meet in the middle at four as well. It's also worth noting barrel files are not that problematic in library code in comparison to application code.
After testing, I had an idea to simplify the summary and bundle section into one game inspired health bar, as well as improving the grouping of smells by type and file.
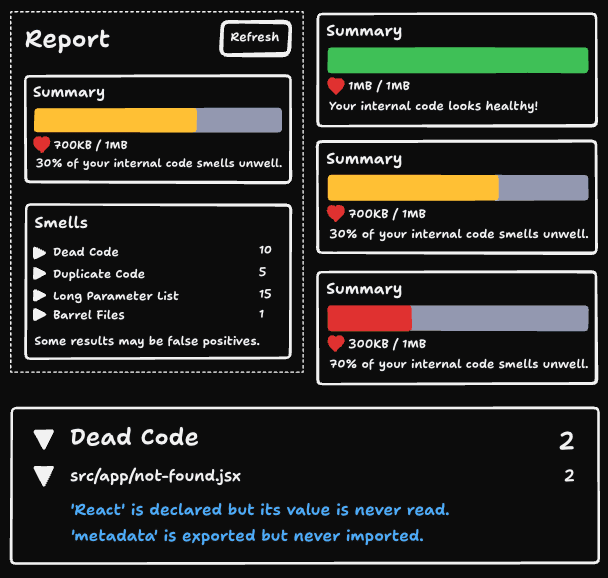
Demo
Roadmap
| Next | Future |
|---|---|
| Release to marketplace. | Identify smells in git diff (prevention and refactor opportunities). |
| A mechanism to provide the git diff smells to HITL workflows. | |
| Trendline. |